Visual Learning Strategies: Enhance Learning and Retention
Did you know 65% of students absorb information best through visuals? This isn’t just about liking pictures—it’s about how brains process complex ideas faster with charts, diagrams, or interactive content. In today’s classrooms, this approach isn’t optional—it’s essential for helping diverse thinkers thrive.
Educators now have more tools than ever to make lessons stick. From color-coded timelines to animated explainers, these methods turn abstract theories into tangible concepts. Think of it like building mental scaffolding—students grasp relationships between ideas when they can “see” connections.
What works for elementary students also helps college learners. A biology major might memorize cell structures using 3D models, while a middle schooler deciphers math problems through step-by-step infographics. The result? Better test scores, sharper critical thinking, and classrooms buzzing with “aha!” moments.
Key Takeaways
- Nearly two-thirds of students process information most effectively through visual methods
- These techniques boost understanding across all age groups and subjects
- Modern technology makes implementation easier than ever before
- Effective visual teaching involves structured systems, not random images
- Educators can start with simple tools and scale up as confidence grows
Understanding Visual Learning

In a world overflowing with text, visuals cut through the noise to anchor knowledge. This approach taps into how minds naturally work—turning abstract ideas into clear patterns we can grasp instantly.
Defining Visual Learning and Its Importance
At its core, visual learning uses imagery like charts, diagrams, and graphics to explain academic content. Unlike lectures or hands-on activities, it speaks directly to those who think in pictures. Our brains process images 60,000 times faster than text, making this method feel almost effortless for many.
It’s not about replacing words with pretty pictures. Effective techniques link symbols to ideas—like using a family tree diagram to teach historical timelines. This creates mental hooks that help facts stick long-term.
The Role of Visual Aids in Enhancing Comprehension
Think of infographics as knowledge translators. They take dense textbook chapters and transform them into bite-sized visual stories. A study on cell biology showed students using 3D models scored 23% higher on retention tests than peers using text alone.
These tools work because they mirror how we organize thoughts. Color-coded maps make geographical relationships obvious. Animated videos turn chemical reactions into memorable narratives. When ideas look connected, students understand how they actually connect.
Effective Visual Learning Strategies
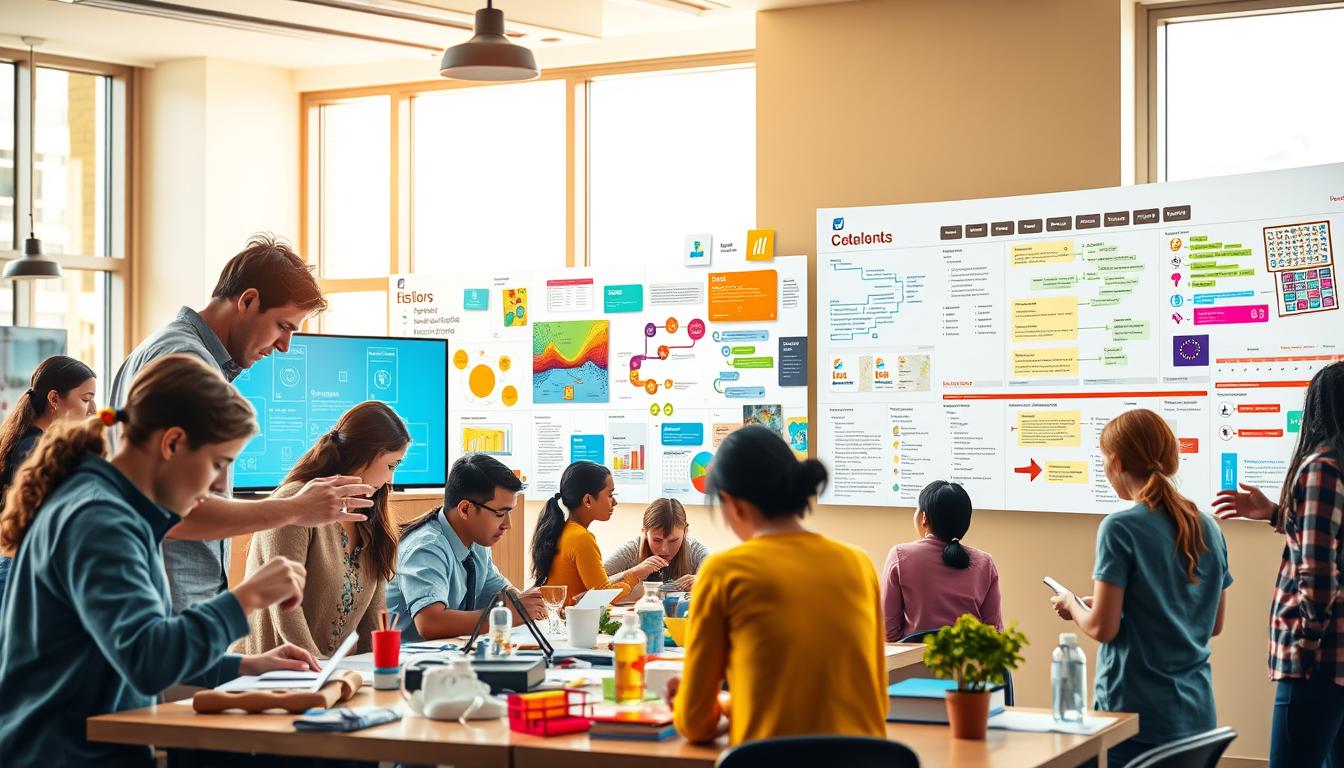
Imagine walking into a classroom where colorful timelines stretch across walls and digital screens showcase rotating concept maps. This environment doesn’t just look exciting—it primes minds to absorb information through strategic visual design.
Implementing Techniques in the Classroom
Start with anchor charts that stay visible throughout units. A math teacher might display fraction models beside real-world examples like pizza slices. History instructors could use flowcharts to show cause-effect relationships between historical events. Consistency matters—regular exposure helps cement connections.
Digital platforms let educators extend these methods beyond physical spaces. Upload annotated diagrams to course portals for homework review. Share video demonstrations that pause at key moments for reflection. One middle school reported 40% fewer clarification questions after adding visual study guides to their online hub.
Interactive and Engaging Approaches
Turn spectators into creators with mind-mapping sessions. Students diagram story plots using sticky notes or digital tools like Miro. Science classes build 3D atom models with everyday materials, photographing each step to create process timelines.
Gamification adds spark—try “diagram races” where teams compete to accurately chart book chapters. Augmented reality apps let learners explore human anatomy layers by pointing tablets at posters. When hands get busy, brains stay focused.
These methods work because they mirror how we naturally explore ideas. A well-designed visual classroom becomes a thinking toolkit—always available, endlessly adaptable.
The Science Behind Visual Learning

Our brains are wired to decode images at lightning speed, making visuals a powerhouse for education. When colorful diagrams replace walls of text, neural fireworks ignite. This isn’t magic—it’s biology working exactly as evolution designed.
Neurological Insights and Fast Processing
Here’s what happens inside the skull: visual data activates both the occipital lobe (image processing) and hippocampus (memory formation) simultaneously. This dual activation creates mental Velcro—concepts stick better when multiple brain regions collaborate. Research shows graphic organizers boost recall 1.8x faster than notes alone.
Improving Retention and Understanding
Think of infographics as brain fertilizer. They help learners grow connections between ideas through spatial relationships and color cues. Students using flowcharts in chemistry classes solved complex equations 42% faster than peers relying on textbooks. Why? Visual patterns create shortcuts for the mind.
Memory thrives on structure. When students map out concepts visually, they build mental filing systems. One study found color-coded timelines increased historical event retention by 73% compared to traditional lectures. Seeing truly becomes remembering in these scenarios.
Incorporating Visuals in Education

Classrooms today face a critical choice: screens or posters? Smartboards or sticky notes? The answer lies in blending both approaches. Modern education thrives when tactile materials meet digital innovation, creating layered experiences for diverse thinkers.
Digital Versus Physical Visual Aids
Digital tools bring lessons to life with interactive elements. Platforms like Nearpod let students manipulate 3D models of volcanoes or explore virtual museums. Updates happen instantly—a biology diagram can showcase the latest research with one click. These resources shine in hybrid classrooms, where shared screens bridge physical distances.
Physical materials anchor concepts through touch. A wall-mounted timeline becomes a daily reference point, unlike tabs that get closed. Younger learners especially benefit from handling fraction puzzles or color-coded flashcards. Paper doesn’t need Wi-Fi, making it reliable for low-tech environments.
Balance creates flexibility. High schools might project animated graphs while distributing printed study guides. Colleges could combine VR anatomy labs with 3D-printed bone models. The goal? Match the tool to the task—use digital for dynamic content, physical for constant visibility.
Utilizing Digital Tools for Visual Engagement

Teachers now wield powerful tools to turn screens into learning canvases. Modern platforms transform static lessons into dynamic experiences where concepts come alive through clickable diagrams and collaborative spaces. These systems meet students where they live—in digital environments that reward curiosity with instant visual feedback.
Features of Canvas LMS and Other Platforms
Canvas LMS shines with its drag-and-drop course builder. Educators embed interactive timelines in history modules or attach 3D molecular models to chemistry assignments. Real-time annotation tools let instructors highlight key details on uploaded infographics during video calls. Students revisit these marked-up resources anytime—crucial for mastering complex topics.
Virtual whiteboards like Lucidspark take collaboration further. Learners cluster color-coded sticky notes into concept maps during brainstorming sessions. Ready-made templates for Venn diagrams or flowcharts save prep time. “It’s like having a smart classroom wall that spans continents,” notes a middle school tech coordinator using the platform.
Maximizing Interactive Tools in Remote Learning
Remote environments thrive when tools promote hands-on participation. Try split-screen video lessons: teachers demonstrate equations on digital whiteboards while students replicate steps in their own workspace. Breakout rooms become design labs where teams build shared mind maps analyzing novel themes.
Gamified quizzes with progress-tracking heatmaps keep learners motivated. Geography classes race to label interactive maps, earning badges for accuracy. These approaches combat screen fatigue by making every click purposeful—and every visual interaction meaningful.
Best Practices for Educators

Great teachers know that every classroom tool must earn its place. This section reveals how to craft visual materials that drive real results while staying responsive to student needs.
Aligning Visual Content with Curriculum Goals
Start by mapping images to standards. A Civil War timeline becomes powerful when linked to historical analysis skills in Common Core. Ask: “Does this diagram clarify or complicate?” Science models should mirror textbook vocabulary while simplifying complex processes.
Create visual rubrics with students. Co-designing graphic organizers for essay writing helps learners see how structure supports arguments. Math classes might develop symbol keys for word problems together. Ownership boosts engagement.
Gathering Feedback to Enhance Visual Experiences
Try quick pulse checks: “Thumbs up if the flowchart helped.” Track which study guides get dog-eared versus ignored. Digital tools like Google Forms let students anonymously rate materials.
Watch how learners interact. Do eyes glaze over during slideshows? Do hands reach for 3D models? Adjust based on these silent signals. One teacher swapped infographics for comic strips after noticing improved quiz scores.
Refine resources quarterly. Archive less effective aids in a “visual toolbox” for optional review. Celebrate wins when updated materials boost assessment averages. Continuous improvement keeps classrooms dynamic.
Designing a Visual Classroom Environment

A classroom’s layout speaks before the teacher does. Strategic design turns four walls into active learning partners, guiding eyes to key concepts and hands to exploration. Let’s build spaces where every glance teaches.
Creating Engaging Displays and Learning Zones
Dedicate wall areas to rotating concept maps. Place them at student eye level near group tables. High-traffic zones like entryways work best for schedules and rubrics—students see them daily without crowding.
Arrange furniture to create “idea corners.” A science nook might display rock cycle diagrams beside specimen jars. Math zones could feature measurement charts with manipulatives. Movement matters—ensure clear paths between interactive stations.
Selecting the Right Materials and Tools
Choose laminated charts over paper posters—they survive sticky fingers. Magnetic boards allow quick updates. Color-code subject areas: blue for math tools, green for science references. This system helps students grab resources fast.
Mix physical and digital aids. Bulletin boards showcase student-made infographics. Tablets nearby access 3D models of the same concepts. Dual formats reinforce ideas through multiple senses.
Update displays quarterly but keep core tools visible. A grammar wall might cycle weekly examples while maintaining permanent punctuation guides. Balance novelty with familiarity to spark curiosity without overwhelming.
Engaging Visual Learners in the Digital Age
Interactive whiteboards and mind maps are reshaping how classrooms operate. These tools turn abstract concepts into touchable experiences, meeting today’s learners where they thrive—in dynamic, tech-friendly spaces.
Powering Up With Collaborative Tools
Virtual whiteboards let students manipulate ideas in real time. Imagine a history class dragging event tiles across a timeline or math teams solving equations on shared screens. Every mark becomes a conversation starter, sparking deeper discussions.
Mind-mapping software takes brainstorming further. Color-coded branches help organize research projects visually. Biology students might map ecosystems, linking species with drag-and-drop lines. These digital diagrams grow as understanding deepens.
Educators report 30% faster concept mastery when combining these methods. The secret? Tools that mirror how minds naturally connect information. When learners build knowledge visually, they own the process—and the results speak for themselves.
FAQ
What makes visual learning effective for students?
How can educators integrate visual strategies into lessons?
Are digital tools better than physical aids for visual engagement?
Why do mind maps improve understanding?
How do visuals align with curriculum standards?
What role do interactive displays play in modern classrooms?
Can visual methods support diverse learning styles?

Sharon Molly is a content creator in lifestyle, fashion, and travel, delivering style-savvy advice and destination insights to inspire confident living. With a background in digital media, she combines aesthetics with practical guidance for modern women on the go.